Project summary
Re:Housed transforms how Toronto's policymakers and city planners identify optimal shelter locations, providing recommendations that uniquely prioritizes the needs of unsheltered individuals to ensure effective housing transitions, now and in the future.
Keywords
Geospatial Analysis, Shelter Placement Optimization, Urban Planning, Public Policy, Service Accessibility, Social Impact, Artificial Intelligence (AI), Machine Learning (ML), Predictive Modeling, Data-Driven Decision Making, Clustering, Random Forest.

List of technologies
Development Environments
- Google Colab — our main platform for building and training machine learning models
- Visual Studio Code — our main local development environment
- Anaconda — for managing packages and environments
Languages & Data Formats
- Python — our core programming language
- CSV — primary format for storing and exchanging data
Libraries & Frameworks
- Data Analysis: Pandas, NumPy, SciPy
- Visualization: Matplotlib, Seaborn, Folium— for interactive maps
- Geospatial Tools: GeoPandas, Shapely, Google Earth Engine
- Machine Learning: scikit-learn
Project development
Solution Overview
Developed in consultation with City of Toronto housing leaders, Re:Housed identifies areas best suited for new shelters by modeling where supportive infrastructure aligns with the needs of the unhoused.
Our innovation combines two geospatial models. This dual-model approach ensures recommendations consider both immediate service access and long-term social stability:
- Service Accessibility Model: highlights areas with strong access to services that support housing transitions (e.g., healthcare, transit, social services).
- Risk & Social Network Model: highlights areas where unhoused communities and higher risks of homelessness are concentrated, based on existing methodologies.
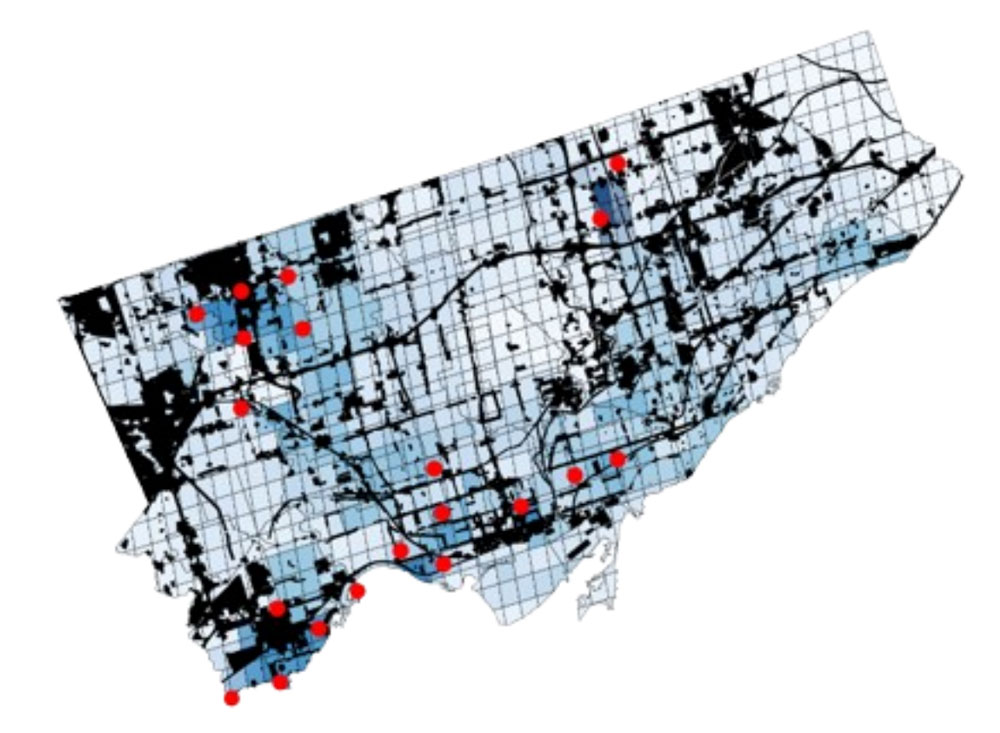
By layering these two approaches, our model (shown in the image below) identifies 20 priority areas across the city. These are the locations where supportive infrastructure and homelessness risk overlap most strongly. Areas where Toronto cannot legally build (e.g., industrial or restricted zones) are excluded, shown in black on the map.

How Our Approach Works
Finding Areas With Relevant Services: To ensure homeless shelters are not only a location for individuals to access immediate shelter, but also act towards their transition towards housing, it is imperative that shelters are located around relevant supportive services. While broad goals of transportation, healthcare, legal resources, and other public facilities are recognized as important, the distribution and emphasis of each service is a challenge to discern. In order to identify areas that are close to the services unhoused individuals need for an effective transition, we infer that the services around existing encampments will resemble the services unhoused individuals may look for. Re:Housed divides the city into a rotated grid of 1 km² cells, enriched with data on proximity to services like public transit, food banks, medical services etc. A Random Forest Regressor, trained on historical encampment data, predicts encampment size in each cell based on these features. The results are visualized using interactive maps. The tool provides planners with clarity on where the greatest needs exist and where infrastructure may support new shelter development.
Finding Areas Close to Supportive Social Networks: Through conversation with stakeholders, it is emphasized that shelter intake calls in Toronto may often distribute individuals to less preferred or distant locations. Distant migration and change can make it difficult for individuals to build towards housing. As such, our model prioritizes recommending regions where existing social networks may already exist, reducing entry barriers to the housing transition and building more supportive systems. By modelling areas at risk of homelessness by replicating Urban Institute’s “Emergency Rental Assistance Priority Index” which applies classification and prediction algorithms in order to output a riskmap of areas most vulnerable to housing instability, we may infer previous networks for these communities may be. Simultaneously, this layer helps city planners understand where interventions are most urgently needed.
Building the Project
Our development process unfolded over three weeks:
- Week 1 (Foundations): We focused on defining the problem and setting up our data schema. This included understanding business requirements, gathering datasets from the City of Toronto Open Data Portal, and creating an action plan.
- Week 2 (Engagement & Modeling): We reached out to key stakeholders, some of whom shared feedback through interviews on what resonated and what needed improvement. This ensured our solution stayed aligned with real-world needs. In parallel, we began refining our initial models and changing our approach to align with stakeholder input.
- Week 3 (Refinement & Delivery): We tuned our models further, incorporated ongoing feedback, and developed both the frontend interface and our project website.
Our final model combined a random forest classifier with clustering methods to generate a geospatial map. This map highlights possible shelter locations across Toronto that balance accessibility to services with areas of high future demand.
Impact/Innovation
Why it Matters
Re:Housed directly supports social good by enabling a more responsive approach to Toronto’s homelessness crisis. It empowers city planners to target interventions where they are needed most and ensures that limited resources are distributed more equitably.
What Makes It Different
While some tools exist, such as Hamilton’s Homelessness and Housing Dashboard, these mainly provide data visualizations and insights to describe the problem. Re:Housed, however, creates solutions by recommending specific shelter sites based on both risk and service accessibility, while providing data-driven insights into emerging patterns and risk assessments in Toronto for planners to use more generally. [also operate under a more accurate demand metric than occupancy]
Risks & Safeguards
We recognize the sensitivity of applying AI in social contexts. There is always a risk of misinterpretation or misuse of model outputs. For example:
- Compromising privacy: if raw or non-anonymized data were ever leaked or made public, exposing vulnerable populations.
- Reinforcing systemic inequities: if the data itself is biased, or if correlated risk factors are misread as causal, recommendations could lead to siting shelters primarily in already marginalized neighborhoods, further entrenching disadvantage.
- Misinterpreting trend data: outputs could be mistaken for predictions about individuals rather than city-wide patterns, which risks reinforcing stigma or creating the false impression that consultation and planning are unnecessary.
To reduce this, we:
- Use only aggregated and anonymized data
- Embed safeguards against bias, consistently refining our model approach
- Engage directly with key stakeholders, communities, advocates to ensure recommendations are guided by equity and care
It is also important to note that Re:Housed is not an automated decision-maker. It is a decision-support tool to aid city planners, while humans always make the final decisions about shelter placement.
The Bigger Picture
Although developed for Toronto, our framework is adaptable to other municipalities with similar data. It can also be extended to related applications such as emergency relief planning.
Challenges
Our journey was shaped by three key challenges:
- Framing the problem: One of our biggest hurdles was refining the problem itself. While stakeholder input took time, the feedback we received proved invaluable, helping us move from a broad concept like “AI for homelessness” to a model grounded in real-world needs. Stakeholder feedback reshaped our model in several ways: introducing new constraints, such as the need for shelters to remain close to people’s communities and social networks; adding nuance, by showing that NIMBYism is widespread and that neighborhood receptivity is less useful to predict; and shifting priorities, with walkability rising higher than hospital proximity, since shelters often bring services in-house.
- Defining demand: We first assumed shelter demand could be measured by occupancy, capacity, and the factors shaping these metrics. A key stakeholder, Michael Lyster, pointed out that beyond the fact that most shelters already run at or near full capacity, many individuals are distributed to shelters far from where they know and frequently are changing locations, making occupancy not reliable as a metric. This insight pushed us to find more accurate ways of assessing in-demand locations.
- Technical deployment: We also tackled the challenge of deploying our web application, from making the local project site mobile-friendly to finally launching it on the cloud.
Although the three weeks had their twists and turns, our team is proud of how we navigated each challenge, turning obstacles into learning opportunities and ultimately building a stronger solution.
What we learned and accomplished
Re:Housed has been recognized for its high promise in impact, innovation, and readiness for real-world application, receiving two major honors:
- Toronto Accelerator Award 2025 — awarded by the AI4Good Lab to projects demonstrating strong potential for social impact and scalability.
- Top 10 Finalist (out of 120+ teams nationwide) in the Youth Impact Challenge’s 2025 Summer Innovation Challenge, a competition that funds and mentors youth-led projects tackling Canada’s most pressing social and environmental challenges.
One of our biggest lessons was learning how to think critically about tough problems. The process was challenging and full of iteration, but we came to appreciate that those repeated cycles are what make a solution truly meaningful.
Along the way, we gained hands-on experience setting up and deploying an end-to-end machine learning system, turning messy data into a clear and compelling story, and designing a web application that made our model both accessible and usable. Most importantly, we learned how to translate real-world requirements into technical tasks that could actually move the problem toward a solution.
What’s next for the project
We hope to continue developing Re:Housed by seeking out resources and funding to extend its capabilities, and by sharing our findings in a research paper in order for others to build on and improve our ideas. We are especially interested in improving our model by incorporating predictions made by shelter intake call locations, acting as a strong marker in demand. We are also interested in expanding our project through closer communication with stakeholders and exploring the model’s transferability in other municipalities facing crisis.
Re:Housed began as a simple lunch table conversation, and we’re grateful to see how far it has come.
Acknowledgements & References
Acknowledgements:
We’d like to thank the following people for their contributions to our work and in making this project possible:
- Diana Moyano (Mentor and Project Manager, Vector Institute)
- Eptehal Nashnoush (AI4Good Lab Re:Housed TA)
- Michael Lyster (Director of Housing and Shelters, Homes First Society)
- Loretta Ramadhin (Director of Infrastructure, Planning & Development, The City of Toronto — The Toronto Shelter & Support Services Division)
- Kiefer Shields (Property Services Supervisor at Shelter, Support & Housing Administration, The City of Toronto)
- Tia Aprile (Municipal Property Assessment Program)
Finally, thank you to all the creators, coordinators, speakers, and all others involved in the AI4Good Lab program for giving us the opportunity to create Re:Housed.
References:
- City of Toronto. Homelessness Services Capital Infrastructure Strategy: Real Estate Strategy and Lease Extensions. December 21, 2023. https://www.toronto.ca/legdocs/mmis/2024/ec/bgrd/backgroundfile-241830.pdf
- ESRI Canada. Addressing Homelessness Using the Geographic Approach. November 7, 2024. https://resources.esri.ca/government/addressing-homelessness-using-the-geographic-approach
- Urban Institute. Mapping Neighborhoods with the Highest Risk of Housing Instability and Homelessness. July 11, 2023. https://www.urban.org/data-tools/mapping-neighborhoods-highest-risk-housing-instability-and-homelessness
- City of Toronto Open Data https://open.toronto.ca/